Limitations
Known defects and open problems, stated plainly. None of these is hidden elsewhere in the documentation.
Long edges across open water
Delaunay tiles the convex hull, which means it triangulates across concavities. The North Sea, the Irish Sea and the English Channel are concavities, so the raw triangulation produced edges like these:
| length | between |
|---|---|
| 920.8 km | Great Yarmouth and Shetland |
| 779.9 km | Barra and the Isles of Scilly |
| 397.6 km | Eastbourne and the Lizard |
Each is one hop, identical in the mechanism's eyes to a next-door neighbour. They are wormholes, and they wrecked the output distribution for the postcodes that touched one.
This is fixed by default. Edges longer than 50 km are cut, which is an absolute
claim — no two UK postcodes 50 km apart are neighbours under any reading of the word —
rather than a density judgement. Measured on the August 2026 build it removes 264 edges
of 5.36 million, fragments the graph not at all, and needs no bridging. --max-edge-km
changes the threshold; --max-edge-km 0 disables it.
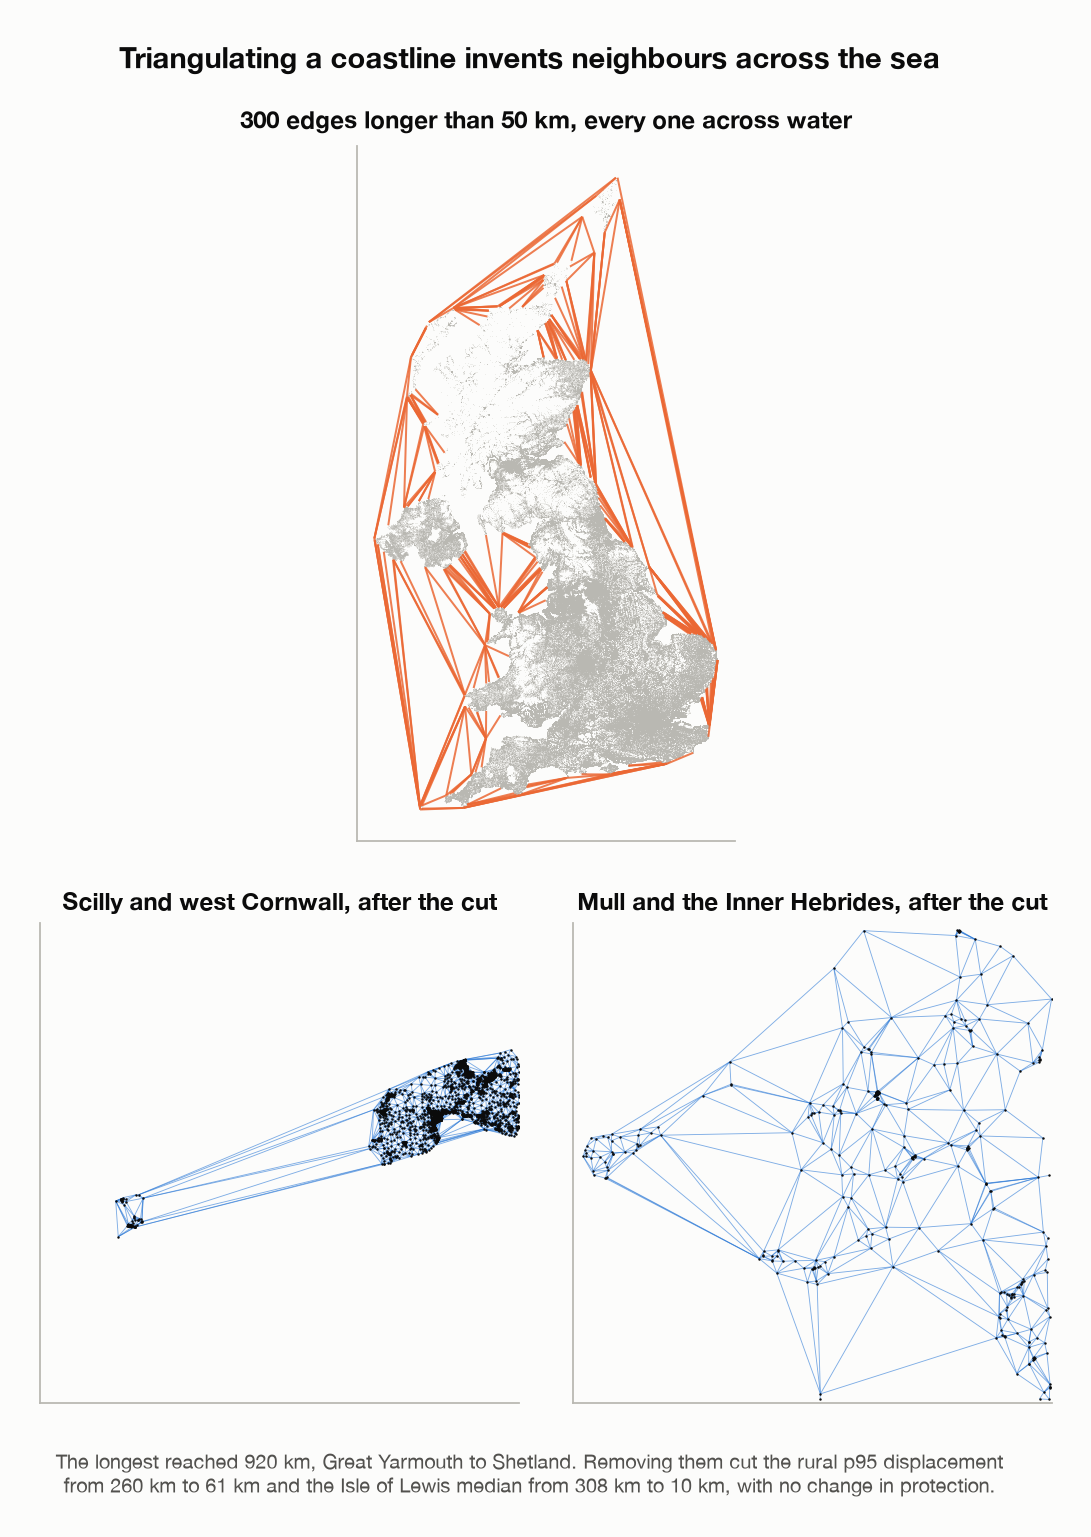
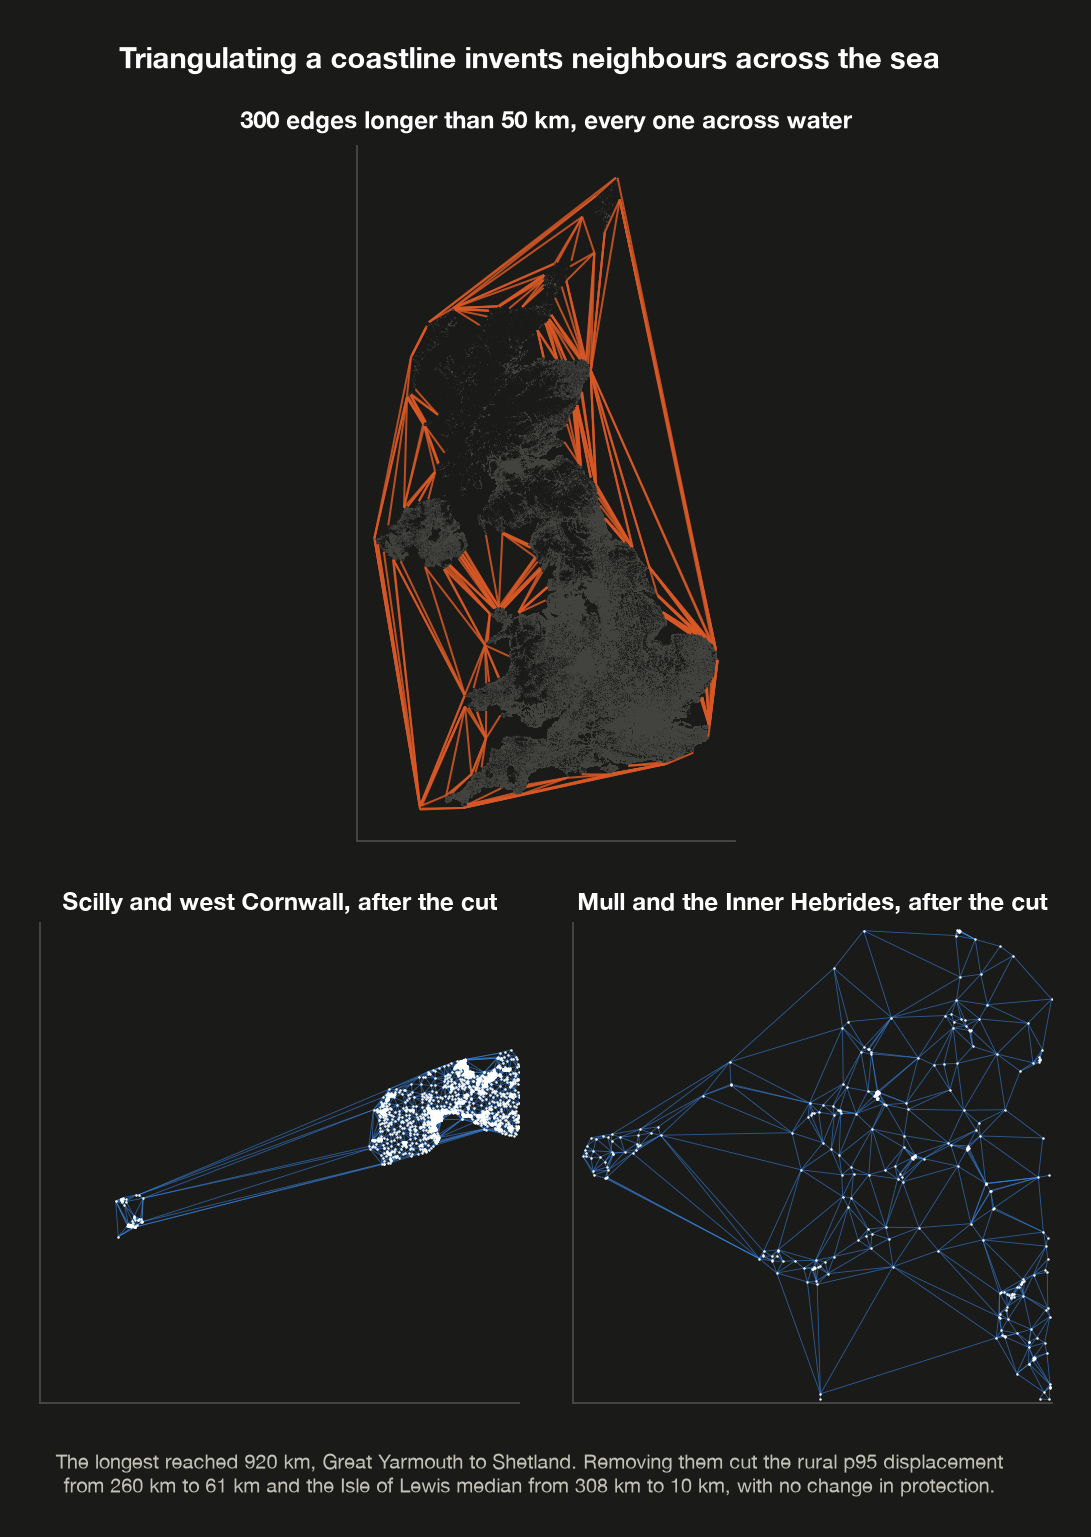
Every edge longer than fifty kilometres, and two island groups as they stand once those edges are gone.
What it cost and what it bought
| before | after | |
|---|---|---|
| rural p95 displacement | 260.3 km | 60.7 km |
| urban p95 displacement | 9.9 km | 9.8 km |
| rural self-probability | unchanged | unchanged |
| Isle of Lewis, median | 307.9 km | 10.0 km |
Self-probability is unchanged to three decimal places, so the privacy the mechanism delivers is exactly what it was. The cut is a pure utility repair.
A correction
An earlier version of this page argued that the 308 km figure on Lewis was the mechanism honestly reporting that few people live near a Lewis resident, and that no graph construction could remove it. That was wrong. It was not a floor, it was a wormhole: a single absurd edge, and removing it reduced the figure thirtyfold with no change in protection. The lesson is recorded rather than quietly edited out, because the reasoning sounded plausible and was not checked against a measurement until afterwards.
What is still unfixed
A 50 km cut cannot distinguish a 2 km crossing of the Thames at Woolwich, which is a 15 km drive, from 2 km over open country. Those short-but-impassable edges remain, and no purely geometric rule removes them: water and empty moorland are the same object in a point set, a gap with nothing in it. Parameter-free alternatives do no better — Gabriel and relative-neighbourhood graphs keep an estuary-spanning edge for the same reason.
The information needed is not in the data. The promising test is a detour ratio — road distance divided by straight-line distance — because it is a measurement rather than a classification, and it is exactly what separates an estuary from a moor. It would also catch railway cuttings, uncrossable motorways and military ranges without naming any of them. That needs routing data and is deferred.
Replacing the graph with a road network, as the Geo-Graph-Indistinguishability work does, is less attractive here than it first appears. In this library the nodes are postcodes, so one hop means roughly fifteen households, which is why exposure comes out flat across urban and rural below. Road network nodes are junctions, so hop count would track junction density instead — unrelated to how many people live along a road.
Measured utility
At \(\varepsilon = 1\), twenty-five sampled postcodes per group, on the August 2026 build of 1,725,511 nodes:
| group | median | p95 | same LSOA | self-probability |
|---|---|---|---|---|
| urban | 0.49 km | 9.81 km | 28.9% | 2.269% |
| rural | 2.62 km | 60.74 km | 27.0% | 2.204% |
The self-probability column is a sample of 25 per group and should not be read as a precise ratio; a larger measurement of 150 per group puts the urban median at 2.541% against a rural 1.937%, a difference of 1.31×, with a roughly fivefold spread within each group. The point stands and is the design working — a postcode is handed back about as often in Sutherland as in Leeds, across a four-order-of-magnitude difference in how much ground a postcode covers — but the honest form of it is a distribution, not a single ratio. See Why not just truncate?.
The remaining rural spread in kilometres is the intended consequence: where there are few postcodes nearby, the nearest ones genuinely are far away.
People who move house
The randomness is keyed on (subject_id, postcode). A subject who moves therefore gets an
independently drawn new output, which costs a second \(\varepsilon\) and whose relationship
to the first leaks information about the move having happened.
Keying on subject_id alone instead would correlate the two outputs through a shared
quantile, which has its own disclosure problem. Neither option is free. Version 1 takes
the former and documents it here; a proper treatment needs a sequential-release analysis.
Key compromise removes the guarantee
Anyone holding both the key and the graph artefact can evaluate the mechanism themselves, and so eliminate with certainty every postcode that does not map to the observed output. What is left is usually a handful of candidates rather than exactly one — the mapping has collisions — but that residual ambiguity is an accident of arithmetic, not a designed protection, and it does not survive any auxiliary knowledge about where the subjects live. Treat compromise as disclosure of the source postcodes.
The key is not a convenience; it is as sensitive as the source dataset and must be handled that way. Note also that rotating it is a privacy cost here rather than a hygiene measure: a new key re-perturbs everyone, which is a second release of the same people. See the threat model for the full statement, including the computational nature of the guarantee and the conditions under which repeated releases count as one observation.
The output looks exact
The mechanism emits a plausible real postcode. A downstream analyst who has not read this
page may reasonably mistake it for the true value. Name the output column so that it
cannot be confused — the CLI defaults to postcode_dp for this reason — and say so in
whatever data dictionary travels with the release.
Northern Ireland
ONSPD's Northern Ireland records are licensed from Land & Property Services and may not
be redistributed, so any artefact you intend to share must be built with --gb-only.
Separately, no Northern Ireland population source has been incorporated, so the
population prior falls back to uniform there.
Coverage of the population prior
England and Wales use 2021 Census Output Area populations, split evenly across the postcodes in each area. Scotland uses the National Records of Scotland per-postcode figures, which are finer. The prior is therefore of mixed resolution across the United Kingdom. The guarantee is unaffected — any prior is admissible — but utility comparisons between nations should be read with this in mind.
Aggregate statistics are out of scope
This library perturbs individual postcodes. It does not produce differentially private counts or statistics by geography. That is a related but separate problem requiring different machinery, and combining a per-record mechanism with aggregate release needs a composition analysis this library does not provide.